
Photodiode Amplifier or Electrometer? A Practical Readout Guide
Choose a photodiode amplifier or electrometer: compare noise, bandwidth, quadrant readout, and Python/EPICS integration, with worked examples.
A photodiode amplifier converts light-generated current into a signal you can measure. A digital electrometer can combine that conversion with digitization, selectable ranges, and a computer interface. The right choice depends on the complete measurement: current level, signal speed, detector capacitance, channel timing, and the data your software needs.
For a single detector with a custom analog signal chain, a transimpedance amplifier may be the right starting point. For a quadrant detector or an automated test setup, an integrated electrometer can reduce the work needed to turn detector currents into synchronized, usable data.
Start With the Measurement Requirements
Before choosing hardware, write down these six requirements:
- Current range: Record the smallest useful signal, normal operating current, and largest expected peak. Include background light and startup conditions.
- Time resolution: Decide whether you need a steady average, a waveform, or the total charge in a pulse.
- Detector and cable capacitance: Use the detector specification at the intended bias and account for the cable connected to the input.
- Channel count and timing: Decide whether channels can be read sequentially or must represent the same instant.
- Bias and connections: Check polarity, permissible bias voltage, common electrodes, connectors, and grounding.
- Software output: Specify whether you need individual samples, averaged values, accumulated charge, or a calculated position.
This list is more useful than choosing solely by the smallest advertised current or the highest sampling rate.
How a Photodiode Transimpedance Amplifier Works
A transimpedance amplifier, or TIA, converts input current into output voltage using a feedback impedance. At low frequencies, the ideal resistive-feedback relationship is:
Here, is the feedback resistance, is the amplifier reference voltage, and the sign depends on the chosen current direction. The amplifier holds its input near the reference potential while the current develops a voltage across the feedback resistor. A complete design must also account for input bias current, offset, stability, and output headroom. Analog Devices explains the photodiode/TIA model and error sources.
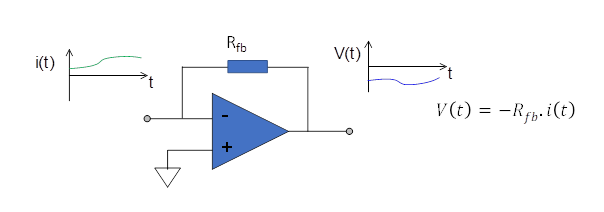
Conceptual F-type current-to-voltage converter, from Choosing F or I Devices for Current Measurement. This illustrates the topology, rather than an FX4 circuit schematic.
Consider an idealized design with 2 V of usable output excursion in the required direction:
| Feedback Resistance | Output Magnitude at 10 nA | Current Producing a 2 V Excursion |
|---|---|---|
| 100 kΩ | 1 mV | 20 µA |
| 1 MΩ | 10 mV | 2 µA |
| 10 MΩ | 100 mV | 200 nA |
These are arithmetic examples, not FX4 specifications or complete circuit designs. Increasing resistance makes a small current easier for an ADC to resolve, but reduces the current that fits within the available output excursion. A range that works in darkness may saturate when the light level rises.
Noise, Bandwidth, and Sampling Rate
A useful photodiode readout must meet its noise target at the bandwidth required by the experiment.
- Analog bandwidth describes how the input circuit responds to changing current.
- Sampling rate describes how often the ADC digitizes that response.
- Averaging or filtering changes the noise and time response of the reported data.
- Host update rate describes how often the computer receives or displays results.
A faster ADC cannot recover detail already removed by the analog input filter. Similarly, increasing the rate of a Python polling loop does not increase the instrument's sampling rate.
Detector capacitance, amplifier characteristics, and the feedback network affect TIA stability and bandwidth. Cable capacitance belongs in that analysis too. A detector tested with a short connection may behave differently after a long cable is added. See Texas Instruments' transimpedance-amplifier guidance and its discussion of bandwidth dependence on capacitance and feedback resistance.
For approximately white noise, RMS noise scales with the square root of equivalent noise bandwidth. Reducing that bandwidth by a factor of 100 would reduce that noise contribution by about a factor of 10. It also changes how quickly the measurement can respond. Drift, interference, and low-frequency noise do not necessarily follow this simple rule. Analog Devices discusses TIA noise and equivalent noise bandwidth.
For an approximately flat input-referred current-noise density over the relevant passband:
Here, is in and equivalent noise bandwidth is in Hz. As an illustrative calculation, over 100 Hz gives 100 fA RMS; over 10,000 Hz it gives 1 pA RMS. These are assumed values, not FX4 noise specifications. Equivalent noise bandwidth depends on filter shape and is not automatically the same as the −3 dB bandwidth.
Ask for noise figures with the range, bandwidth, averaging time, and input conditions stated together.
Photodiode Amplifier or Digital Electrometer?
These categories overlap: a current-measuring electrometer may use a TIA internally. The practical distinction is how much of the measurement system you need to build.
| Requirement | Standalone TIA and Separate DAQ | Integrated Digital Electrometer |
|---|---|---|
| Custom analog response | Direct control of amplifier and filter design | Choose among the instrument's supported ranges and filters |
| Digitization | Select and integrate the ADC or DAQ | Digitization is part of the instrument |
| Multiple channels | Arrange timing, gain matching, and calibration | Check whether acquisition is simultaneous and how channels are calibrated |
| Detector bias | Provide and validate the required bias arrangement | Check available bias options and input topology |
| Software | Combine DAQ drivers, scaling, and configuration | Use the documented instrument interface |
| Development effort | Appropriate when a custom circuit is central to the system | Useful when the priority is deploying a measurement system |
A dedicated wideband photoreceiver may be a better fit for very fast optical signals. A charge-integrating instrument may be preferable when the quantity of interest is charge per pulse or very small currents at long integration times. Pyramid's current-versus-charge measurement guide explains these tradeoffs in more detail.
Quadrant Photodiode Readout: A Worked Example
A quadrant photodiode produces four currents. Differences between opposite halves provide position-sensitive signals; their sum provides an intensity-related signal. Label the quadrants consistently:
| Left | Right | |
|---|---|---|
| Top | A | B |
| Bottom | C | D |
After correcting measured offsets, define:
For A = 30 nA, B = 40 nA, C = 10 nA, and D = 20 nA:
- S = 100 nA
- X = 0.20
- Y = 0.40
In this convention, the signal is weighted toward the right and top. If every current doubles, the normalized X and Y values remain unchanged in the ideal model.
These values are dimensionless, not millimeters. Position calibration depends on beam profile, spot size, detector geometry, and operating region. Do not divide by a sum near the noise floor; reject low-signal or saturated measurements before calculating position. Opto Diode describes the normalized quadrant-current approach.
Channel timing matters as well. If the light changes while a multiplexed system reads successive quadrants, those values may not describe the same beam state. Simultaneous acquisition helps avoid that particular source of error; it does not eliminate channel mismatch or optical calibration errors.
Calculate Quadrant Position in Python
This standalone processing example uses the quadrant labels above. Supply simultaneous, offset-corrected currents with polarity chosen so illumination produces a positive total. Set min_sum from measured background noise and the minimum useful signal; 5 nA is only an example threshold.
from math import isfinite

def quadrant_position(a, b, c, d, *, min_sum, overloaded=False):
    """Return (sum, x, y); use one current unit for all inputs."""
    if not isfinite(min_sum) or min_sum <= 0:
        raise ValueError("min_sum must be finite and positive")
    if overloaded or not all(isfinite(v) for v in (a, b, c, d)):
        return None
    total = a + b + c + d
    if not isfinite(total) or total <= min_sum:
        return None
    x = ((b + d)  (a + c)) / total
    y = ((a + b)  (c + d)) / total
    return total, x, y

# Example inputs and threshold are all in nA.
result = quadrant_position(30, 40, 10, 20, min_sum=5)
print(result)  # (100, 0.2, 0.4)
The function returns None for low-signal, non-finite, or flagged overload data. Pass the instrument's overload status explicitly; a saturated channel can still contain a finite number. Keep that status with the saved data. This calculation processes measurements already acquired; it does not connect to an FX4 or define its API.
Connecting the Readout to Python and EPICS
The software interface should be part of instrument selection from the start. Confirm that it exposes the measurements, configuration, and status needed by the experiment.
For a useful acquisition program:
- Record configuration: Save current range, filtering, channel mapping, units, and detector bias alongside the data.
- Preserve timing: Use instrument timestamps or sequence information where available. A computer receive timestamp is not necessarily the acquisition time.
- Separate acquisition from display: Plotting every received point can slow a program. Reduce the display rate without silently discarding the measurements you intended to save.
- Handle invalid data: Record overloads, missing data, and connection interruptions rather than treating them as zero current.
- Validate throughput: Check the documented data path and sustained output rate. ADC rate, API delivery rate, and GUI refresh rate are different specifications.
A WebSocket interface provides a route for exchanging data with Python software. An EPICS interface fits laboratories already using process variables and control-system tools. Neither interface alone guarantees deterministic timing or delivery of every ADC sample.
Where the FX4 Fits
The FX4 four-channel electrometer is a candidate for quadrant photodiode and segmented-detector readout when simultaneous current acquisition and software integration are priorities. It provides 100 kHz simultaneous digitization, a built-in web interface, an HTTP/WebSocket API, and an embedded EPICS server.
Its arithmetic functions and configurable analog outputs support calculated signals, including beam-position monitoring. Optional bias hardware should be selected for the detector's voltage, polarity, and wiring requirements. The 100 kHz digitization figure is not a claim of 100 kHz analog bandwidth or guaranteed continuous host streaming.
The FX4 product page includes the datasheet, user and programmer manuals, and a downloadable Python WebSocket example. Use those documents to check the selected range, bandwidth, input compatibility, and supported acquisition mode before building the experiment.
Before You Choose Your Readout
Bring together the detector model, expected minimum and maximum current, pulse or waveform timing, cable length, channel count, and software environment. Check noise and saturation at the intended settings, then test the complete chain with representative signals.
For help matching that chain to an instrument, contact Pyramid sales and engineering. Include the detector datasheet and measurement requirements so the discussion can start with the application.
Related guidance: Choosing F or I Devices for Current Measurement, Calibration of Current and Charge Measuring Devices.