
Local Dose in Water
How pencil-beam lateral size changes local dose in water: Bragg curves, on-axis voxels, and peak dose versus energy and sigma.
Dose delivered in water is a key metric for proton therapy. The human body is predominantly water to a fair approximation, so performance measures and quality assurance procedures are often based on the dose distribution in water. Pair this note with medical proton beam parameters for range and rigidity lookup, and with transmission IC selection when nozzle dose delivery is the product question.
Relative Depth-Dose Curves
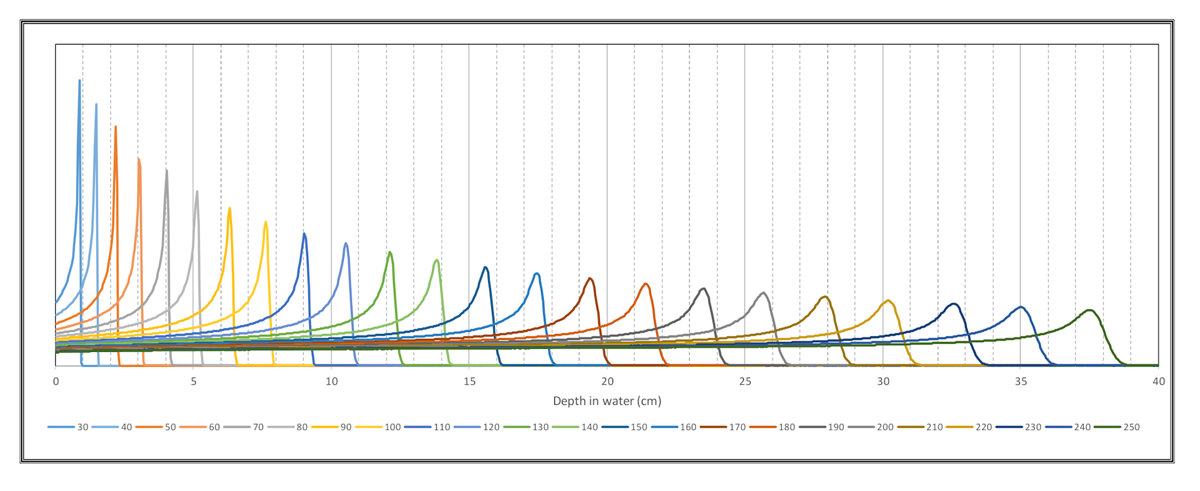
The depth-dose curve in water as a function of proton energy is familiar. The figure shows relative dose delivered to layers for energies over the usual therapy range.
These are the relative curves that would be measured for a broad uniform transverse distribution of beam over an area much larger than the (water equivalent) dose sensor. They are also what you would see if you pass a small pencil beam through a large-area (water equivalent) sensor. In other words, information about the transverse distribution is not included.
Local Dose Along a Pencil Beam
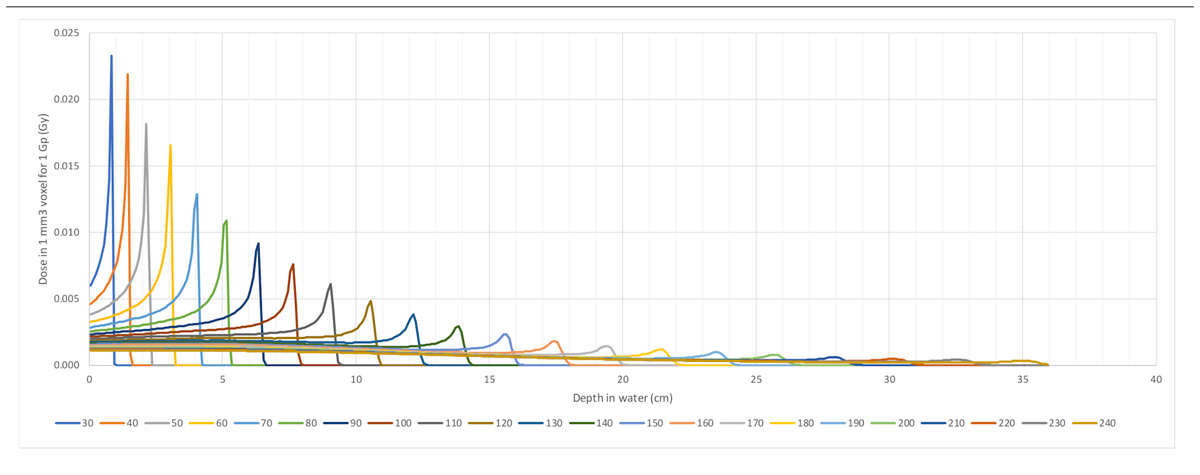
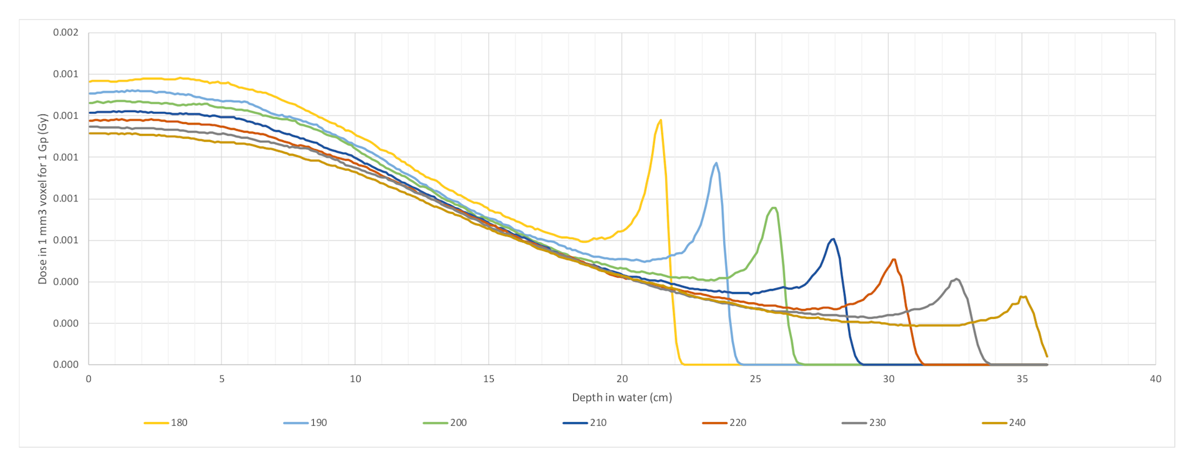
At any moment, pencil beam scanning delivers dose locally, and the full three-dimensional distribution must be considered if the maximum dose in a small voxel is required. Consider a 2 mm sigma beam entering the water, which is around the smallest lateral dimension available in normal proton therapy systems, and then only at higher beam energies. If we calculate the local dose in 1 mm voxels along the beam axis for an incident one gigaproton, the dose curves are notably different from the relative layer plots above. One gigaproton is delivered in 160 ms by a 1 nA proton beam current.
Lateral spreading of the beam reduces the maximum local dose on axis at greater depths, and the maximum of the depth-dose curve is not at the end of range for energies of 180 MeV and higher (see the zoomed plot). The effect becomes less pronounced as the beam sigma increases, and the local on-axis depth-dose curves tend toward the familiar shapes of the relative plot.
Peak Dose Versus Energy and Beam Width
Peak dose (Gy) in a voxel for 1 gigaproton incident, tabulated by kinetic energy (MeV, rows) and beam one-sigma width (mm, columns). Values marked with an asterisk are for small-sigma, low-energy combinations that are unlikely on most therapy systems (higher low-energy emittance plus nozzle and air-path scatter).
1 mm Voxels
| Energy (MeV) | =2 | =3 | =4 | =5 | =6 |
|---|---|---|---|---|---|
| 30 | 46.60* | 21.11* | 11.80* | 7.62* | 5.32* |
| 40 | 43.75* | 20.02* | 11.31* | 7.33* | 5.06* |
| 50 | 36.30* | 16.85* | 9.68* | 6.27* | 4.43* |
| 60 | 33.12* | 15.91* | 9.48* | 6.04* | 4.41* |
| 70 | 25.76* | 12.92* | 7.77 | 4.96 | 3.65 |
| 80 | 21.80* | 11.43* | 6.83 | 4.50 | 3.17 |
| 90 | 18.31* | 9.95 | 6.19 | 4.23 | 2.98 |
| 100 | 15.18 | 8.69 | 5.52 | 3.87 | 2.74 |
| 110 | 12.14 | 7.28 | 4.79 | 3.46 | 2.45 |
| 120 | 9.62 | 6.18 | 4.19 | 3.05 | 2.30 |
| 130 | 7.59 | 5.26 | 3.54 | 2.64 | 2.03 |
| 140 | 5.86 | 4.09 | 3.01 | 2.23 | 1.78 |
| 150 | 4.64 | 3.45 | 2.57 | 1.97 | 1.54 |
| 160 | 3.58 | 2.82 | 2.20 | 1.69 | 1.35 |
| 170 | 2.89 | 2.35 | 1.88 | 1.50 | 1.19 |
| 180 | 2.76 | 1.98 | 1.56 | 1.30 | 1.05 |
| 190 | 2.64 | 1.66 | 1.34 | 1.13 | 0.92 |
| 200 | 2.54 | 1.37 | 1.14 | 0.99 | 0.80 |
| 210 | 2.45 | 1.14 | 1.00 | 0.84 | 0.71 |
| 220 | 2.36 | 1.08 | 0.82 | 0.72 | 0.65 |
| 230 | 2.30 | 1.03 | 0.70 | 0.62 | 0.54 |
| 240 | 2.23 | 1.00 | 0.62 | 0.54 | 0.48 |
3 mm Voxels
| Energy (MeV) | =2 | =3 | =4 | =5 | =6 |
|---|---|---|---|---|---|
| 30 | 27.25* | 13.41* | 7.88* | 5.11* | 3.58* |
| 40 | 25.91* | 12.89* | 7.59* | 4.96* | 3.47* |
| 50 | 16.20* | 8.17* | 4.86* | 3.17* | 2.25* |
| 60 | 16.60* | 8.56* | 5.09* | 3.36* | 2.40* |
| 70 | 15.76* | 8.34* | 5.05 | 3.33 | 2.35 |
| 80 | 14.50* | 7.94* | 4.94 | 3.31 | 2.36 |
| 90 | 12.39* | 7.15 | 4.51 | 3.07 | 2.21 |
| 100 | 11.42 | 6.87 | 4.43 | 3.10 | 2.23 |
| 110 | 8.52 | 5.31 | 3.57 | 2.49 | 1.83 |
| 120 | 7.00 | 4.65 | 3.16 | 2.27 | 1.68 |
| 130 | 6.53 | 4.52 | 3.17 | 2.34 | 1.77 |
| 140 | 4.73 | 3.41 | 2.48 | 1.85 | 1.42 |
| 150 | 3.97 | 2.98 | 2.24 | 1.71 | 1.32 |
| 160 | 3.21 | 2.50 | 1.95 | 1.50 | 1.16 |
| 170 | 2.70 | 2.20 | 1.78 | 1.41 | 1.12 |
| 180 | 2.36 | 1.83 | 1.45 | 1.19 | 0.97 |
| 190 | 2.25 | 1.54 | 1.25 | 1.05 | 0.85 |
| 200 | 2.17 | 1.26 | 1.08 | 0.91 | 0.75 |
| 210 | 2.08 | 1.03 | 0.86 | 0.75 | 0.63 |
| 220 | 2.01 | 0.99 | 0.77 | 0.66 | 0.57 |
| 230 | 1.96 | 0.97 | 0.67 | 0.56 | 0.48 |
| 240 | 1.90 | 0.94 | 0.56 | 0.49 | 0.43 |
Thus the peak local dose per incident beam charge is likely to occur in the 70 to 100 MeV range for most systems, depending on the lateral dimensions of the beam entering the treatment nozzle. To determine the actual maximum local dose for a specific machine, the entering beam emittance and the materials in the nozzle and air path must be added to the calculation.
Further Information
Browse ionization chambers and Particle Therapy for nozzle and dosimetry hardware. Related notes: medical proton beam parameters, ion-beam formulae, and transmission IC dosimetry. Contact us or Support if you want a second look at a peak-dose estimate for a Pyramid system.